What are you? We’ll learn how R handles different kinds of data.
But how do I use my own data? We’ll learn how to import data from a variety of different file types using the readr package.
Now that we’ve gotten data into R, we’ll look at how to make the data tidy using the tidyr package.
We’ll learn how to use R to model relationships among variables in the data.
You’ll learn how to turn models into tidy data objects using the broom package.
More graphs! We’ll look at how we can visualize models with multiple predictors using the modelr package.
Well that’s repetitive! We’ll learn how to efficiently repeat the same action multiple times using the purrr package.
You’ll learn how to write your own functions to do tasks in R.
How did we calculate that value again? We’ll learn how to make reproducible reports using the rmarkdown package.
We’ll learn how to extend R Markdown to write research reports and technical documents with the bookdown package.
What interests you? What do you wish we’d talked about more? Let’s do that!
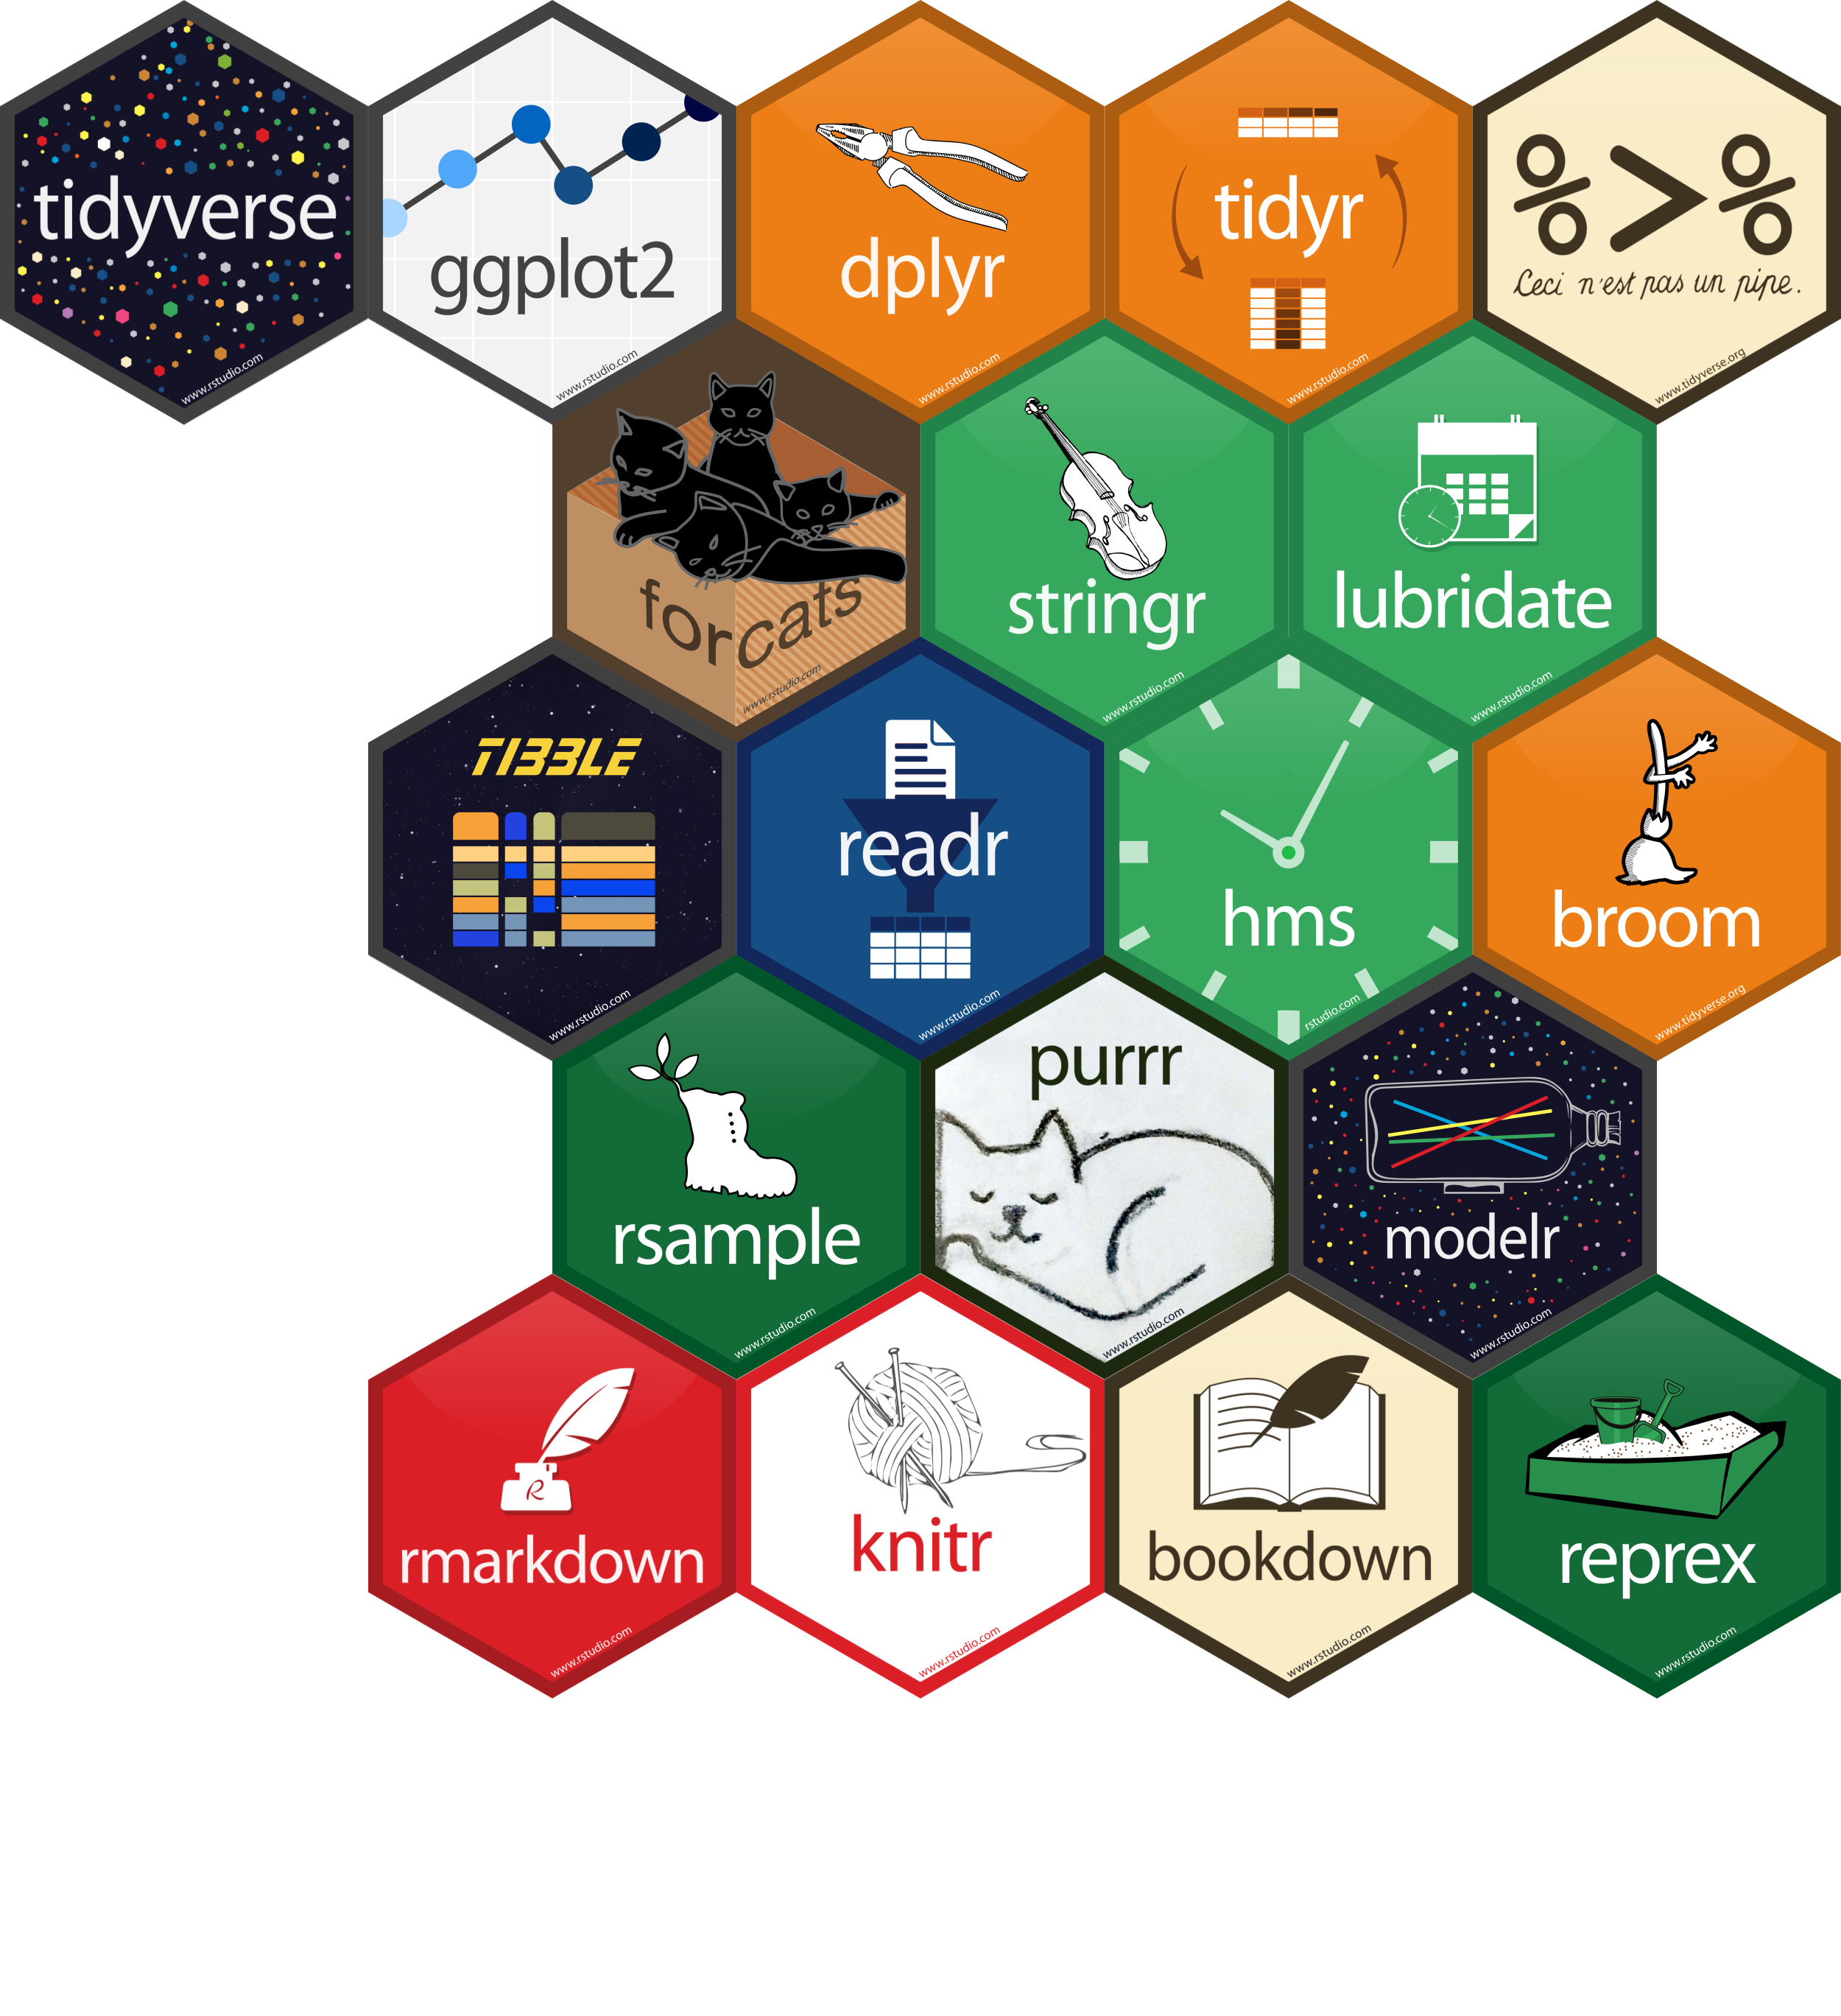
This workshop is designed for those who want to learn how to use R to analyze data. The material is based on Hadley Wickham and Garrett Grolemund’s R for Data Science. We’ll talk about how to conduct a complete data analysis from data import to final reporting in R using a suite of packages known as the tidyverse. The two goals of this workshop are: 1) learn how to use R to answer questions about our data; and 2) write code that is human readable and reproducible. We will also talk about how to share our code and analyses with others.
You should take this workshop if you are new to R, or to the tidyverse, and want to learn how to take advantage of this ecosystem to do data analysis. You’ll get the most from the workshop if you are primarily interested in applying pre-existing R packages and functions to your own data. We will give minimal tutorials on how to write your own functions; however, the main focus will be on using existing tools, rather than building our own.